“Hey guys, do we have some fresh numbers on how we compare against x265 for VOD on these Netflix sequences?” This is one of the most common questions we get asked internally and one of the most difficult to answer with just a single number. So to get these answers, we built a tool. Here we discuss details of this tool along with our perspective on why fair encoder comparisons are so challenging.
https://benchmarks.mainconcept.com/
If you build video encoders, you hear variations of the same question on repeat. Product management asks it before a customer call. Sales and marketing ask for it before trade shows. And a colleague asks in the hallway: “How is our performance against open-source encoders right now?”
It is, of course, a completely reasonable question but also a trap, because the honest answer is not a single percentage number. Quite often, we need to clarify what the other side wants to know exactly and what “better performance” means for them:
-
Raw compression efficiency?
-
The quality versus encoding speed drop-off?
-
The maximum throughput with parallelized encoding on a specific system?
-
For what type of content and resolution?
-
And what about the encoding scenario, i.e., offline encoding for VOD services or live?
We decided it was time to take action to ease the burden on everyone being pulled into these discussions, product management, sales, marketing, engineers, and to provide faster, more reliable answers.
Re-deriving these answers by hand for every conversation was becoming increasingly tedious, as were the methods our industry often relied on to compare encoders: context-free percentage claims and spreadsheets filled with numbers that were difficult to verify or reproduce.
So, we built a dashboard that compares video encoder implementations across the three axes that matter most: bitrate, quality and encoding speed. We call it MainConcept Codec Benchmarks. It enables everyone to explore the results directly rather than relying on headlines or unsupported claims such as “encoder A outperforms encoder B by X%” without the context needed to understand what that actually means.
This post explains the importance of evaluating all three axes to achieve transparent and reproducible encoder comparisons.
What this is and what it is not
As codec developers, we already have many internal tools for deep rate-distortion analysis, performance curve evaluation (what we understand as the quality versus encoding speed trade-off at a fixed bitrate), or rate control decision tracing. These tools are extremely detailed and help answer why a particular encoder makes a particular decision on a particular machine for a particular video sequence. Such tools are indispensable when you are tuning a coding mode or chasing down a regression.
MC Benchmarks is the opposite of that. We wanted something that answers the big, grand-scale question: how do we perform, in general, across a broad field of encoders for the most typical encoding scenarios (VOD and Live encoding) on a large, openly available set of sequences. We compare our AVC/H.264 and HEVC/H.265 encoder implementations in software against the open-source alternatives x264 and x265. We also added NVIDIA’s NVENC for AVC and HEVC into the mix to see if there is any overlap in the rate-distortion-speed space.
The dashboard shows two Bjøntegaard-Delta rate (BD-rate) gauges at the top. These gauges answer how much bitrate one encoder saves versus another, at equal encoding speeds over our test set. We rely on the VMAF v3.0.0 No-Enhancement-Gain (NEG) measure as the industry-standard measure for perceptual quality measurement, alongside PSNR as the single truth for signal fidelity. For a much more detailed analysis, you can open the "Encoder Explorer" below to explore the full rate–distortion–speed surfaces, slice them at a fixed speed or bitrate, compute BD-rate between any pair and export the exact command lines so you can reproduce a measurement yourself. Every view can be shared as a deep link, every plot downloaded as PNG and every table exported to CSV. No paywall the full results are open to everyone.
Of course, we do not limit the encoder comparison to fixed speeds. In cases where speed matters less, you may only want to know the highest compression efficiency an encoder can achieve against a reference. Conversely, in cases where quality matters less (think about low-resolution proxies), you may want to know the quality difference at the highest possible encoding speed between two encoders. Our dashboard also answers these questions; here is an example.
From Rate-Distortion to Rate-Distortion-Speed
BD-rate is the starting point of many encoder comparisons. This method is widely used and originated in MPEG standardization activities decades ago. Instead of comparing two encoders at just one bitrate, their entire rate-distortion curves are compared to determine the average compression gain (or loss) of one encoder over another. Of course, there is a third dimension to encoder comparisons: encoding complexity or speed. This can be measured in several ways, depending on the application. In codec standardization, for example, the complexity of an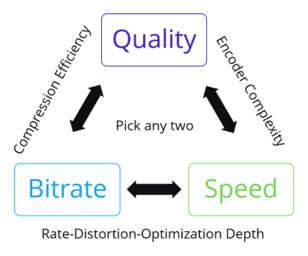 algorithm is often measured as multiplications and additions/accumulations (MAD/MAC) per sample. On the other side of the scale sits measuring the wall-clock time an encoder needs to encode a given number of frames. Sounds easy, but from experience we know that runtime measurements are noisy: repeat an identical encoding and you can see 10% or more spread from cache behavior, kernel scheduling or uncontrolled CPU boosting. Internally, we also deliberated about measuring low-level complexity proxies and experimented with counting CPU cycles. This sounds like a great approach because measuring CPU cycles is very precise when performing repeated measurements with less than 0.5% variability.
However, unlike reference encoders, production-grade encoders are heavily threaded, which makes CPU cycles difficult to interpret. The honest truth is that, in the end, nobody asks us how many cycles per sample our encoders require. They ask how many frames per second we can encode and how many parallel encodings a machine can carry. So, what matters most: maximum encoding speed or maximum throughput? For this reason, we use wall-clock encoding fps as the third axis, the same number for both encoder complexity and implementation efficiency, as this is the number that ultimately guides deployment decisions.
We do not claim our methodology is 100% fair. In fact, no cross-vendor comparison is. We try to keep it fair by keeping per-encoder configuration deliberately minimal. For each encoder we essentially sweep just two knobs: the speed/quality preset (or performance level) and the rate target (VBR for Live, CRF for VOD, falling back to fixed QP for NVENC) and do not hand-tune anything else. We believe that a good encoder implementation should come with good defaults. Matching each encoder’s coding tools across implementations, one-by-one, is a rabbit hole we deliberately don’t want to go down. It can be done, but it serves a more academic than practical purpose. In the end, the preset or performance level is the main control that people will adjust.
When we talk about video quality, there is no single truth. That is why we report the robust VMAF-NEG metric, Y-PSNR and SSIM (for those who can interpret it). An encoder tuned towards perceptual quality can show a large VMAF gain on one sequence but a flat PSNR on the same sequence. Neither metric is wrong, they measure different things. Choose the metric you trust when evaluating all numbers present on Codec Benchmarks.
Our approach also avoids the most popular traps in encoder comparisons: matching presets by name. “Medium” is not a unit and each encoder’s preset sits at different operating points in the rate-distortion-speed space. That is why matching encoding speed is crucial but also difficult. Encoding speed can be influenced by the bitrate target and by the content type too. For an example, observe in the Encoder Explorer how, for many encoders, a rate-distortion-speed curve for a fixed preset slopes to lower encoding speeds at high bitrates. This is why we believe that averaging the rate-distortion-speed surfaces across many sequences and then slicing the interpolated surface at a fixed encoding speed is the fairest comparison possible.
Beyond Excel sheets
Analyzing the rate-distortion-speed trade-off is, of course, not a new idea in research. It is a very common approach to measure the performance numbers and fill them into an Excel sheet to be shared with colleagues and customers. What we have not seen yet, however, is this data being made truly explorable. That is why we love Plotly Dash, which drives the dashboard under the hood! Frankly speaking, we had a hand-crafted prototype of MC Benchmarks running internally for some time already. However, we were lacking resources to polish it for a public release. Now in 2026, with the help of AI tools like Claude Code, the game has changed and, all of a sudden, we were able to let AI polish what video coding experts cannot do so easily, i.e., build a frontend.
This allows us to display interactive surfaces over a broad, current set of encoder implementations, rather than a static figure on paper or tables of BD-rates in a spreadsheet. The data can be manipulated and filtered, allowing drilldowns to sequence level. At the same time, the exact encoder parameterization of every operating point is always visible. As mentioned above, you can also skip the encoding speed interpolation and do a comparison of individual rate-distortion-speed curves (e.g., how does “ultrafast” compare against “slow”). At last, we of course plan to keep the data updated and add more encoders in the future, like VVC or AV1.
What it can’t tell you (yet)
A limitation worth stating, because customers ask it very often, is: “How will your encoder behave on my CPU?”. This dashboard cannot answer that directly. Everything is measured on our fixed evaluation hardware under fixed per-scenario CPU budgets on Kubernetes. That makes the encoders comparable to each other, but it is not your machine. The relative numbers, however, can serve as a guideline: combined with your target hardware, they help to approach practical considerations like maximum encoder density, i.e., how many simultaneous streams a given server could carry. It also cannot tell you directly how much money you can save on your encoding and CDN costs by switching from one encoder to another. If you want answers to such questions, talk to us. That is exactly the kind of thing we love to dig into.
Closing thoughts
Comparing encoders in a fair way is difficult. Codec Benchmarks replaces a single, context-free percentage number with the whole rate-distortion-speed space. The same minimal configuration applies for every encoder, and all operating points and command lines are in the table.
This version of Codec Benchmarks is our first version, so please tell us where we got it right, where we got it wrong or what encoder, scenario or feature you would like to see next. We also acknowledge that a public benchmark is a guideline and not a description of your current situation. Your content and hardware will return different results. The only way to really know is to evaluate on your own sequences and machines. For that purpose, you can always download the demo versions of our SDKs with their corresponding sample applications and measure for yourself.